
Expert Analysis Confirms 85/15 Percent Ratios in 2026 Election Social Media Post Shared by President Trump.
Joe Hoft is a former International Audit and Finance Executive who performed hundreds of audits around the world, oversaw the financial reporting of multi-million and billion-dollar entities, and participated in board, audit, risk, and executive committee meetings in multiple countries and continents.
A post shared by President Trump on Truth Social on Saturday shows a consistent pattern in the results of the 2026 midterm election in 59 Senate and Governor races across the country.
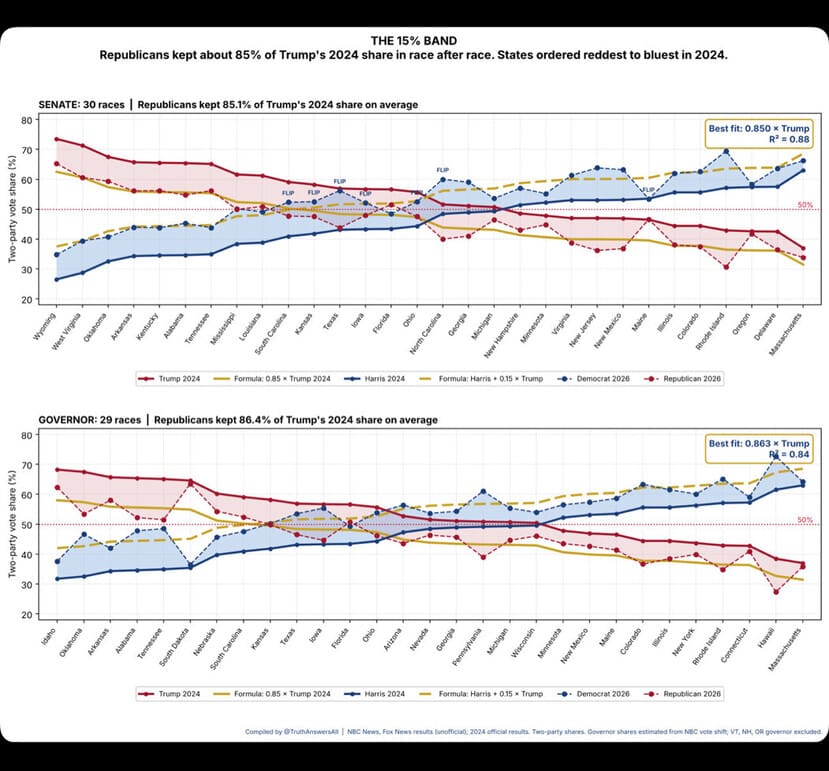
THE 15% BAND
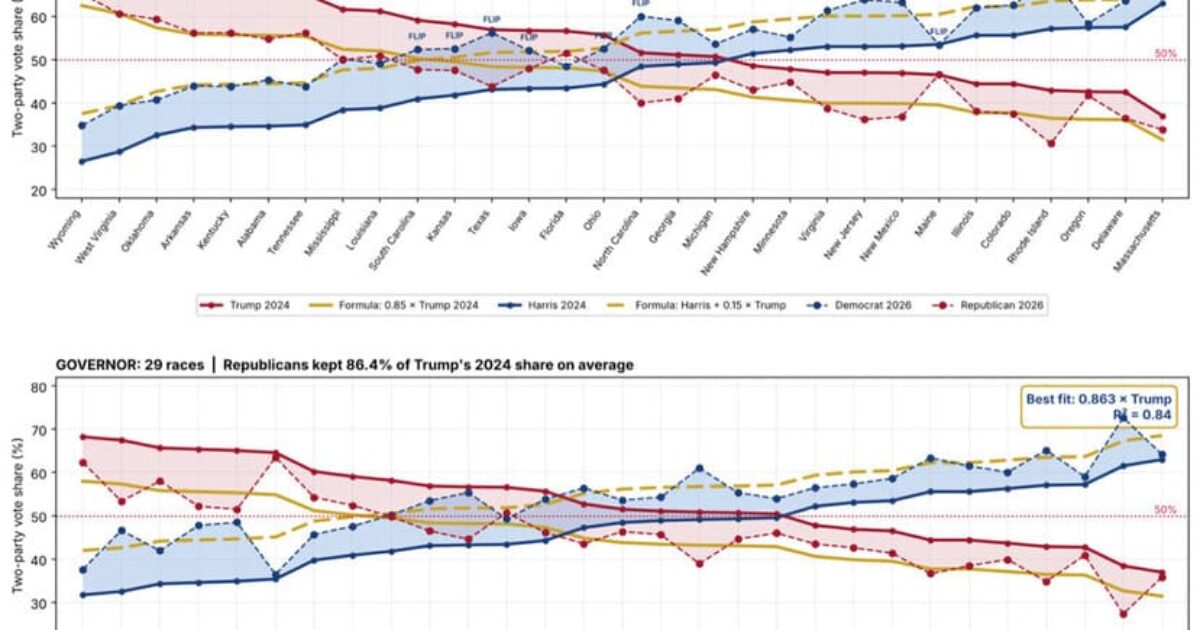
Look at this chart.
59 races. Senate and governor.
States ordered from reddest to bluest in 2024.The solid lines are 2024.
The dashed lines are 2026.
The shaded bands are what moved.One formula fits all of it:
Republican 2026 = 0.85 × Trump 2024
Democrat 2026 = Harris 2024 + 0.15 × Trump 2024For every 1,000 Trump points, 850 stayed Republican. 150 landed on the Democratic side.
The numbers:
Senate: Republicans kept ~85% of Trump’s share
Governor: ~86%Variation explained: 88%
What makes it strange:
It didn’t matter how red the state was. Wyoming, Ohio, Illinois, Massachusetts: same 15% (p = 0.69). The Democratic gain was sized by Trump’s vote, not Harris’s. The Harris part is zero.The 0.85 beat both standard election-swing models in every set of races.
Drop any single state and the multiplier stays between 0.846 and 0.853.Why seats flipped:
At 0.85, any state where Trump got under about 58.5% falls below 50%. Texas, Kansas, Iowa, Ohio, South Carolina, North Carolina: all under that line. All flipped.What this means:
Midterms are messy. This one isn’t. Two sets of races, different candidates, different campaigns, and the same 15% decrease almost everywhere.A pattern this even demands answers at the ballot level: paper ballot hand counts, poll-book check-ins against votes counted, and voter files showing who actually turned out.
The numbers raise the question.
The ballots can answer it.— Truth Is Freedom (@TruthAnswersAll) November 6, 2026
A pattern is not expected, and its presence is concerning and likely indicates wrongdoing.
The data in this post was analyzed using AI. The analysis supported the tweet.
| State | Trump 2024 Votes | 0.85 × Trump 2024 | Current Senate R Votes | Shortfall vs 0.85× | Senate R % | Notes |
| Wyoming | 192,633 | 163,738 | 122,157 | 41,581 | 65% | Held |
| West Virginia | 533,556 | 453,523 | 266,067 | 187,456 | 58% | Held |
| Oklahoma | 1,036,213 | 880,781 | 639,860 | 240,921 | 57% | Held |
| Arkansas | 759,241 | 645,355 | 480,800 | 164,555 | 54% | Held |
| Kentucky | 1,337,494 | 1,136,870 | 784,000 | 352,870 | 55% | Held |
| Alabama | 1,462,616 | 1,243,224 | 917,860 | 325,364 | 55% | Held |
| Tennessee | 1,966,865 | 1,671,835 | 1,138,436 | 533,399 | 55% | Held |
| Louisiana | 1,208,505 | 1,027,229 | 745,961 | 281,268 | 51% | Held |
| South Carolina | 1,483,747 | 1,261,185 | 951,896 | 309,289 | 47% | Flipped |
| Kansas | 758,802 | 644,982 | 505,558 | 139,424 | 46% | Flipped |
| Texas | 6,393,597 | 5,434,557 | 4,249,373 | 1,185,184 | 43% | Flipped |
| Iowa | 927,019 | 787,966 | 630,615 | 157,351 | 46% | Flipped |
| Florida | 6,110,125 | 5,193,606 | 4,211,455 | 982,151 | 51% | Held (special) |
| Ohio | 3,180,116 | 2,703,099 | 2,077,748 | 625,351 | 45% | Flipped (special) |
| North Carolina | 2,898,423 | 2,463,660 | 1,643,114 | 820,546 | 39% | Flipped |
| Georgia | 2,663,117 | 2,263,649 | 1,712,587 | 551,062 | 41% | Held |
| Michigan | 2,816,636 | 2,394,141 | 2,177,618 | 216,523 | 45% | Held |
| Minnesota | 1,519,032 | 1,291,177 | 1,233,465 | 57,712 | 44% | Held |
| Virginia | 2,074,097 | 1,762,982 | 1,380,564 | 382,418 | 38% | Held |
| New Hampshire | 395,523 | 336,195 | 268,559 | 67,636 | 42% | Held |
| Illinois | 2,449,079 | 2,081,717 | 1,486,964 | 594,753 | 37% | Held |
| Colorado | 1,377,441 | 1,170,825 | 932,096 | 238,729 | 35% | Held |
| New Jersey | 1,968,215 | 1,672,983 | 1,023,674 | 649,309 | 35% | Held |
| New Mexico | 423,391 | 359,882 | 266,434 | 93,448 | 37% | Held |
| Oregon | 919,480 | 781,558 | 719,926 | 61,632 | 39% | Held |
| Delaware | 214,351 | 182,198 | 137,764 | 44,434 | 36% | Held |
| Rhode Island | 214,406 | 182,245 | 105,346 | 76,899 | 29% | Held |
Summary
The data shows a consistent and sizable shortfall: in nearly every state, the 2026 Republican Senate candidate received substantially fewer votes than 85% of Trump’s 2024 total. The shortfalls range from tens of thousands in small states to over a million in Texas. This is larger than a simple “85% of Trump” rule would predict in most places.
Is there a pattern?
Yes. The pattern is fairly uniform underperformance relative to the 85% threshold.
Initial observations indicate that the 2026 election was stolen across the country in multiple races, and the extent of wrongdoing matches or exceeds that of the stolen 2020 election.
The post Expert Analysis By International Executive with Multiple Financial and Auditing Degrees and Years of Experience Confirms 85/15 Percent Ratios in 2026 Election Social Media Post Shared by President Trump appeared first on The Gateway Pundit.