

On Saturday, The Gateway Pundit first posted on the algorithmic pattern that perfectly described how Democrats “stole” the 2020 midterm election.
“Truth Is Freedom” on X was the first to discover the algorithmic pattern that played out in 673 of 692 US counties in 2026.
“Truth Is Freedom” discovered that any state where Trump got under about 58.5% in 2024 fell below the 50% threshold in governor and senate races in state after state.
Texas, Kansas, Iowa, Ohio, South Carolina, North Carolina: all lined up under that line. They all flipped to Democrat.
In the US Senate races Republicans kept ~85% of Trump’s share from 2024.
In the governor races Republicans kept ~86% of Trump’s share from 2024.
Here is the equation that played out perfectly in the 2026 election:
Republican 2026 midterm results = 0.85 × Trump 2024 results
Democrat 2026 midterm results = Harris 2024 results + (Trump 2024 x 0.15)
As TGP reported earlier these results were eerily similar to the impossible “Drop and Roll” vote pattern we discovered in the 2020 election that was NEVER explained.
On Monday, Truth Is Freedom released a new chart that displays the results from the 2026 midterm election across US counties that lines up perfectly using the same algorithmic equation first reported days ago.

Obviously, the far left and questionable X voices have attempted to refute this data by the Truth Is Freedom team.
So today, Truth in Freedom released a list of facts and rebuttals to all of the flawed arguments and ridiculous attacks on their work.

All f these points are powerful and factual.
Earlier today, TGP asked them about this one particular argument: Detractors say, “This is just an average.”
Truth Is Freedom responds: “Not an average, a regression.: 35 separate state check. ).849, R2 = ).87
TGP asked the Truth Is Freedom team what this meant.
Here is their explanation:
Regarding the R2 I don’t want you to get too focused on that because that’s not really the part though that makes this unique.
The 0.87 is real, but it’s not what makes 2026 unique. Tight fits have become normal; 2022 was also tight. Critics are already pointing that out.
What’s unique is the combination:
• The drop: Republicans kept 85% of Trump’s share, the largest drop of any midterm since 1994.
• How many fell: 29 of 30 Senate races below Trump’s share. The 30-year norm is about 70%, and the previous high was 84%.
• The same proportion everywhere.
AI also added this:
Imagine you’re trying to guess how 35 students will score on a test.
If all you knew was each student’s grade from last year, and you could predict this year’s score pretty closely for almost every student, that would mean last year’s grade explains most of this year’s result.
That’s what 0.87 means here. The “last year’s grade” is how President Trump did in each state in 2024.Take that number, multiply by 0.85, and you land close to what the Republican actually got in 2026, in state after state.
87% means that one simple rule explains almost all of the results. Only a small slice, 13%, is left over for everything else: the candidates, the campaigns, the ads, the local issues.
That’s what makes it so unusual. Normally, all those other things matter a lot. In 2026, they barely moved the needle.
R² = 0.87 means that 87% of the differences between states in how Republicans did in 2026 are explained by one thing: President Trump’s 2024 share in that state, times 0.85.
In plain terms: if you know how President Trump did in a state, you can predict most of how the Republican did in 2026. Only 13% of the state-to-state variation is left over for everything else: candidates, campaigns, local issues.
The scale runs from 0 to 1:
• 0: the formula explains nothing; the results are random relative to it.
• 1: the formula explains everything; every state lands exactly on the line.
• 0.87: very strong, close to the top of the scale.
Here is a privileged report given to The Gateway Pundit this AM.
We will explain more following the image.
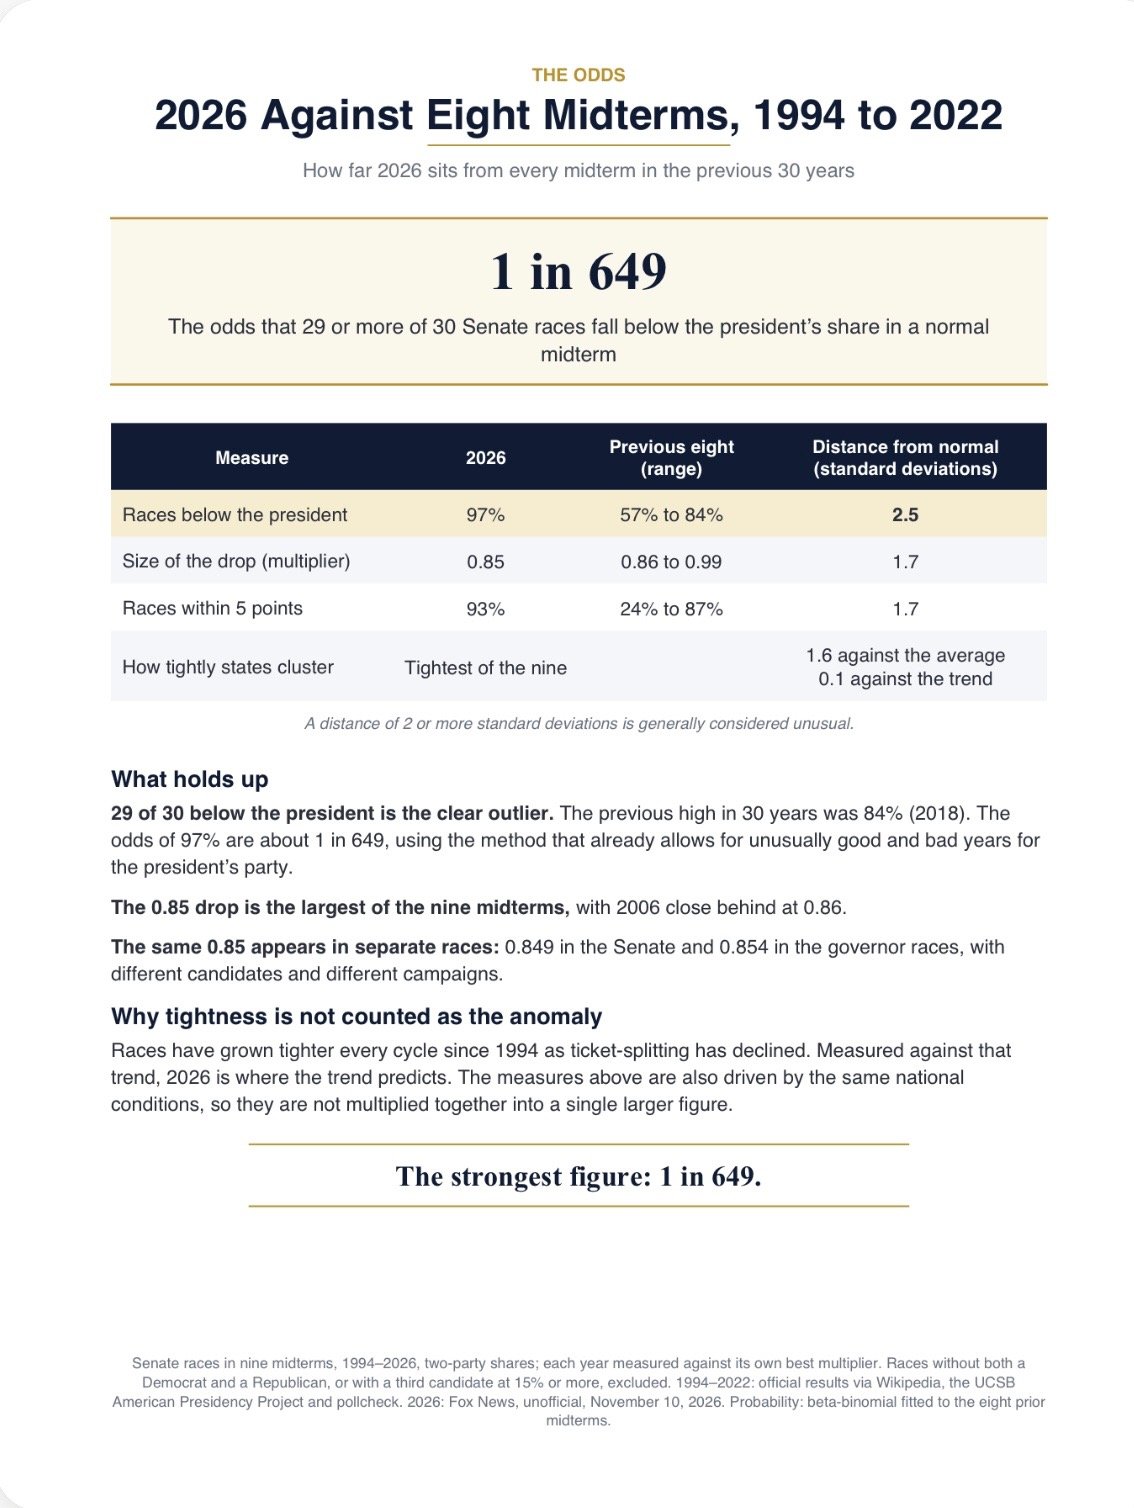
The odds that the 2026 midterm results are legit are 1 in 649, or 00.15%
Or nearly impossible!
The post Big! Big! Big!… New Information by “Truth Is Freedom” Reveals Near Impossibility of 2026 Results – 00.15% Chance These Numbers Are Legit appeared first on The Gateway Pundit.